My Internships

Research Intern
Company Name: Centre for Development of Advanced Computing.
Duration: Jan 2023 - Jan 2024
Description: Developed a Generic ChatBot using Knowledge Graph and Graphs.

Software Developer Intern
Company Name: Baker Hughes.
Duration: Jan 2024 - Present
Description: Currently part of a team working on knowledge graph and software development.

Machine Learning Intern
Company Name: RedX, MIT Academy of Engineering.
Duration: June 2023 - Dec 2023
Description: Worked on a BERT Model to create a Text Summarizer.
Software Developer Intern
Company Name: Steep Graph
Duration: Oct 2023 - Jan 2024
Description: Worked on 3DX Platform and on Project Life Management
Research Intern
Company Name: E Samyak Software.
Duration: May 2022 - Aug 2022
Description: Developed a Visualization Using Power Bi on company database
Research Intern
Company Name: Centre for Development of Advanced Computing.
Duration: Jan 2023 - Jan 2024
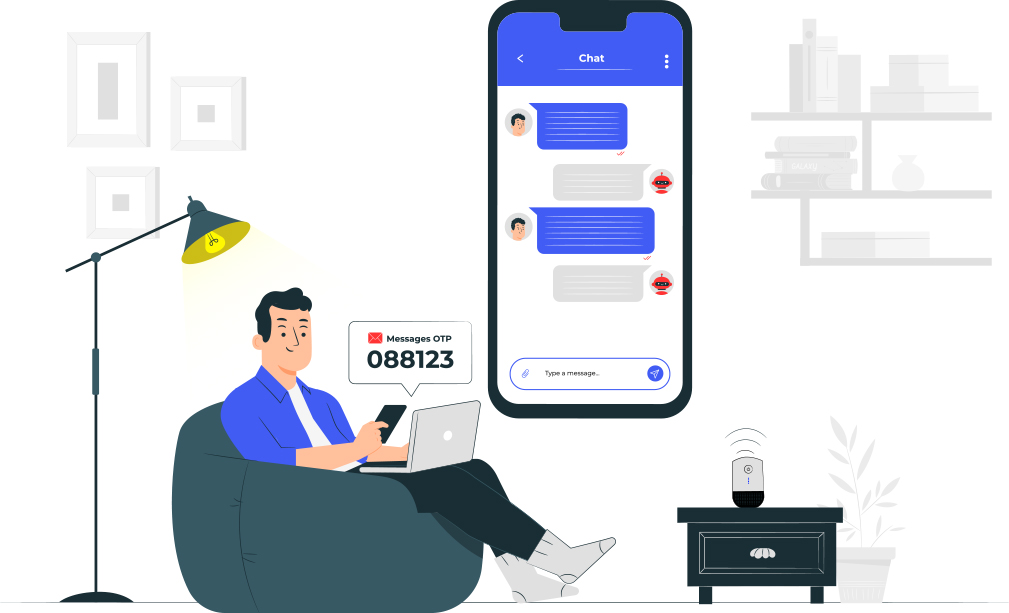
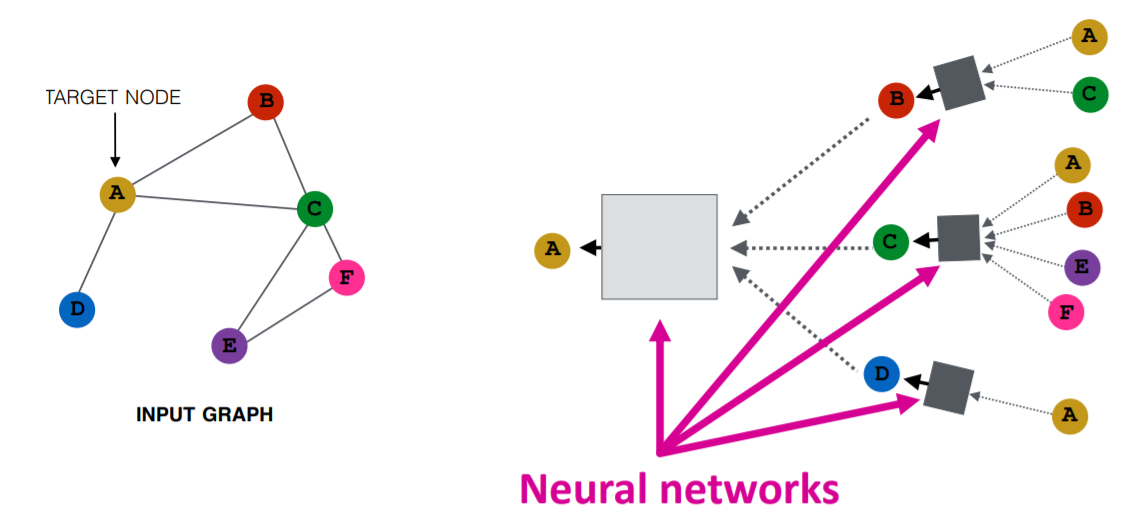
Description: The project involves developing a generic chatbot using Knowledge Graph and Graphs. Knowledge Graph is a powerful technology that can help chatbots understand the context and intent of user queries. It is a network of
entities and their relationships, which can be used to provide more accurate and relevant responses to user queries. In this project, the chatbot is designed to use Knowledge Graph to understand the user's queries and provide relevant
responses. The Knowledge Graph is created using graphs, which are visual representations of data and their relationships. The graphs are used to represent the entities and their relationships in a way that is easy to understand and
analyze. The chatbot is designed to be generic, meaning that it can be used for a variety of applications. It can be customized to fit the needs of different industries and use cases. For example, it can be used in customer service,
e-commerce, healthcare, and many other areas.

Research Intern
Company Name: Baker Hughes.
Duration: Jan 2024 - Present
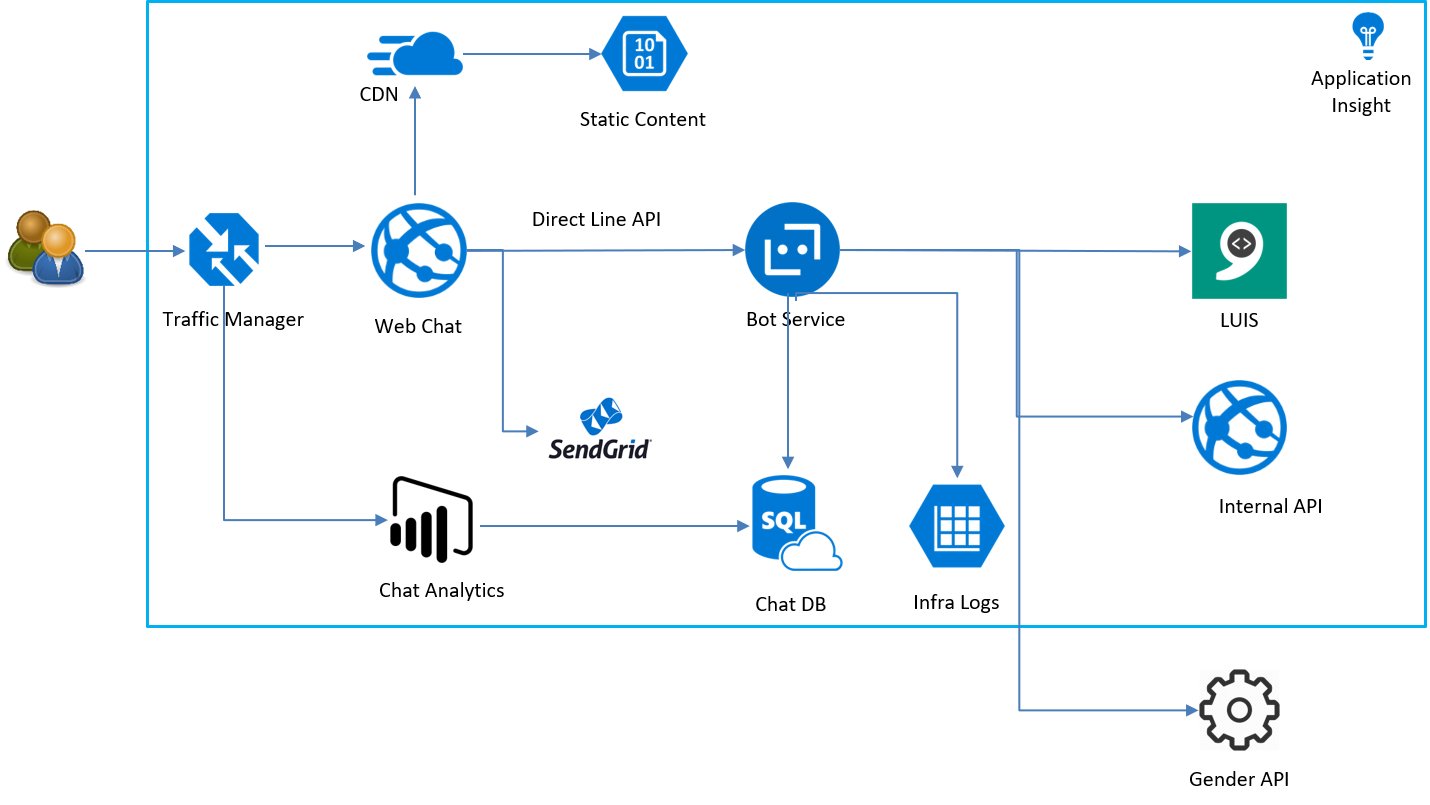
Description: As a member of a team focused on knowledge graph and software development, my primary responsibility is to design and implement software solutions that enable the creation, management, and utilization of knowledge graphs.
A knowledge graph is a powerful tool for data integration, querying, and analysis. It is a network of entities and their interrelationships, represented as nodes and edges in a graph structure. By organizing data in a graph format,
we can gain insights and make connections that would be difficult or impossible to achieve with traditional relational databases. In our team, we work on various aspects of knowledge graph development, including data modeling, data
ingestion, data integration, querying, and visualization. We use a range of technologies, including graph databases, natural language processing tools, and machine learning algorithms, to build scalable and performant knowledge graph
solutions.

Research Intern
Company Name: RedX, MIT Academy of Engineering..
Duration: June 2023 - Dec 2023
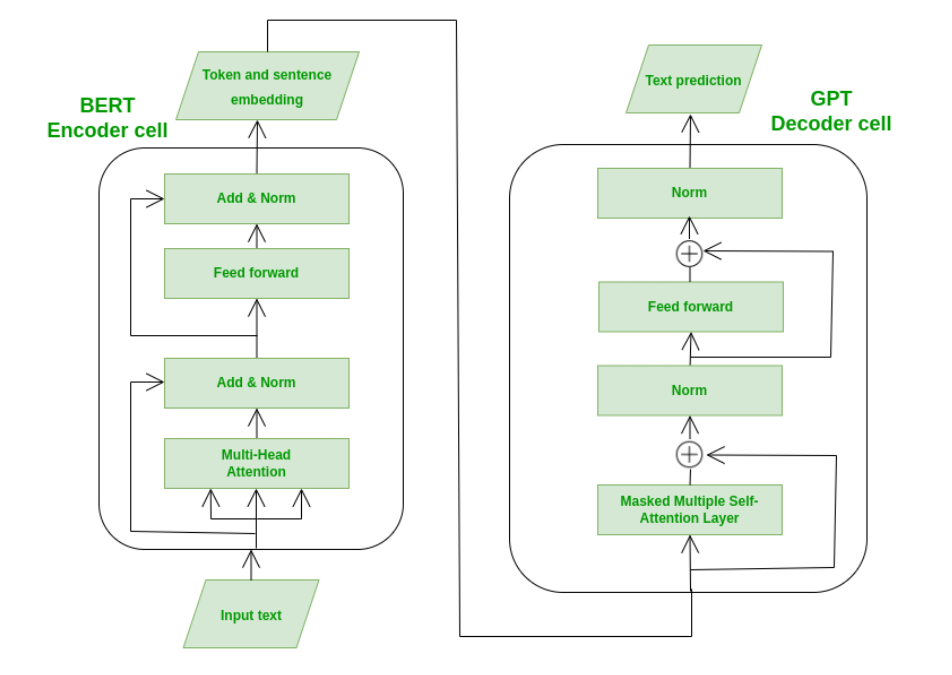
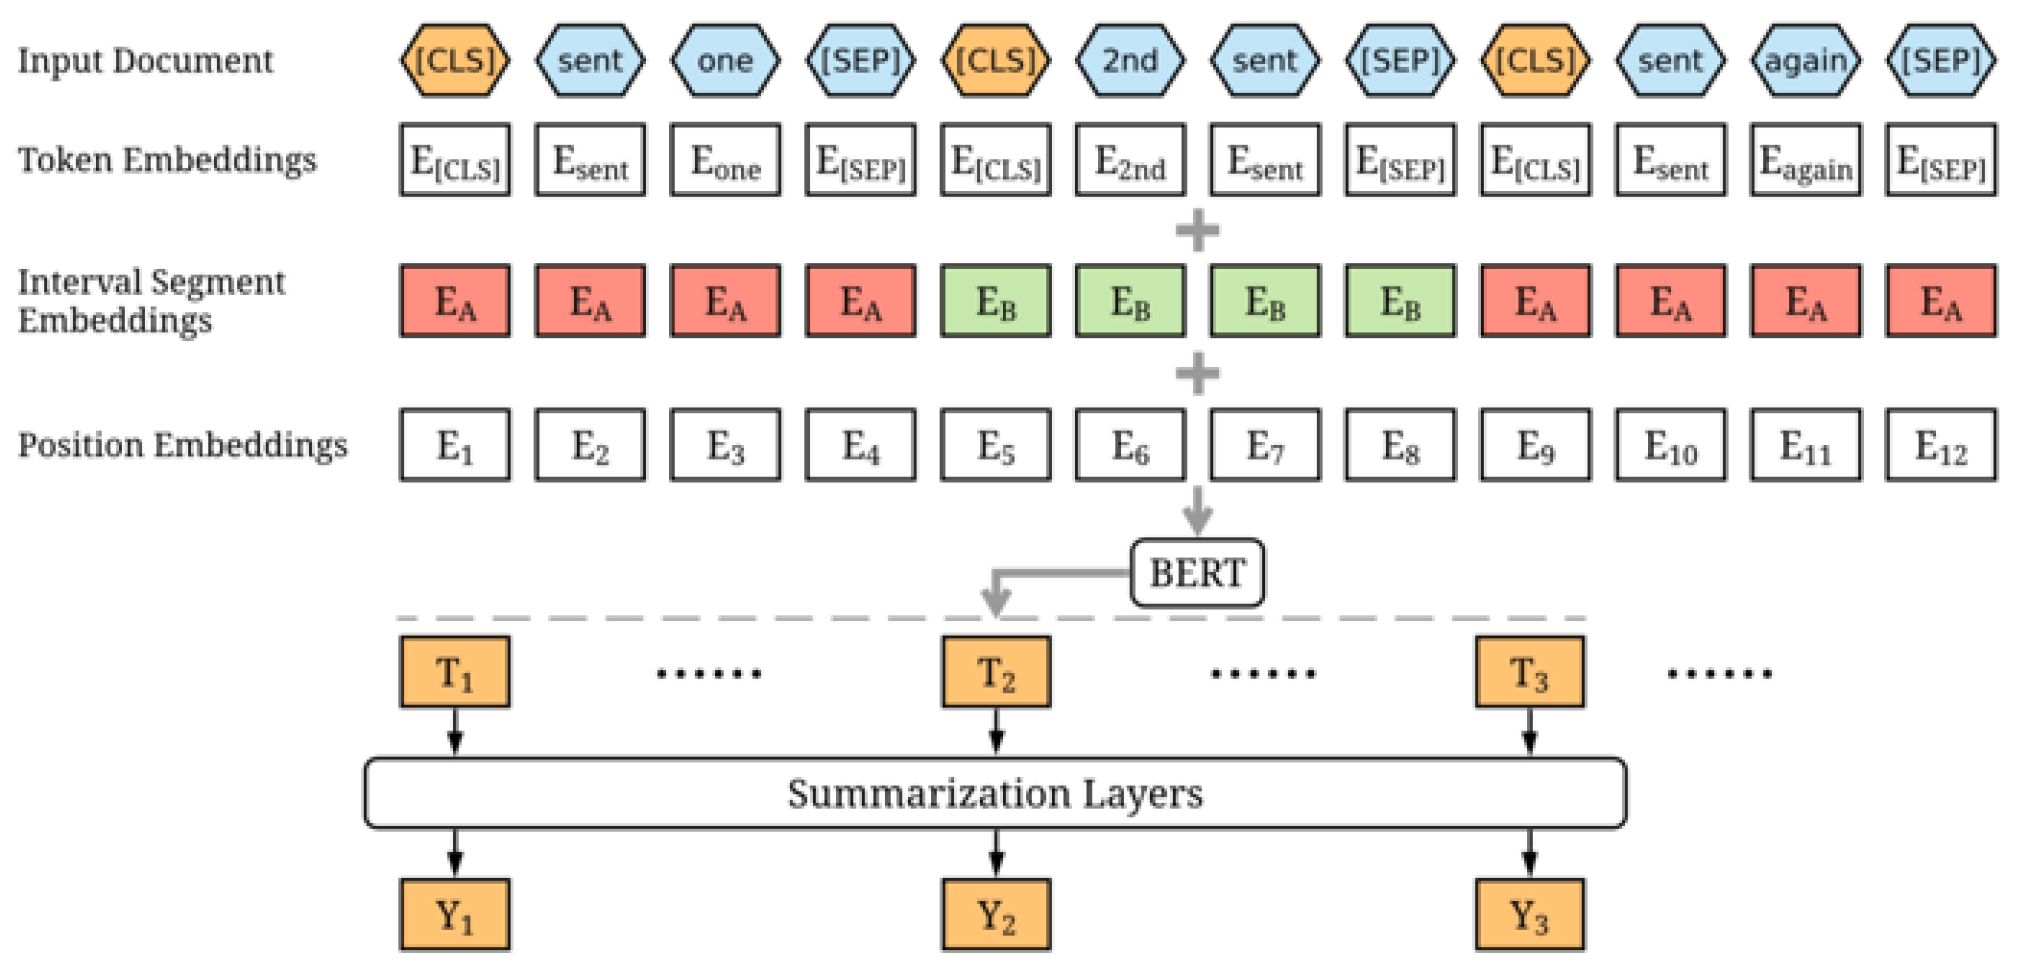
Description: Working on a BERT (Bidirectional Encoder Representations from Transformers) model to create a text summarizer involves leveraging state-of-the-art natural language processing techniques to develop a system that can generate
concise and informative summaries of input text. BERT is a transformer-based model that excels in capturing contextual information from text, making it well-suited for tasks like text summarization. By fine-tuning a pre-trained BERT
model on a summarization dataset, we can teach the model to understand the salient points of a document and generate a coherent summary.

Research Intern
Company Name: E Samyak Software.
Duration: May 2022 - Aug 2022
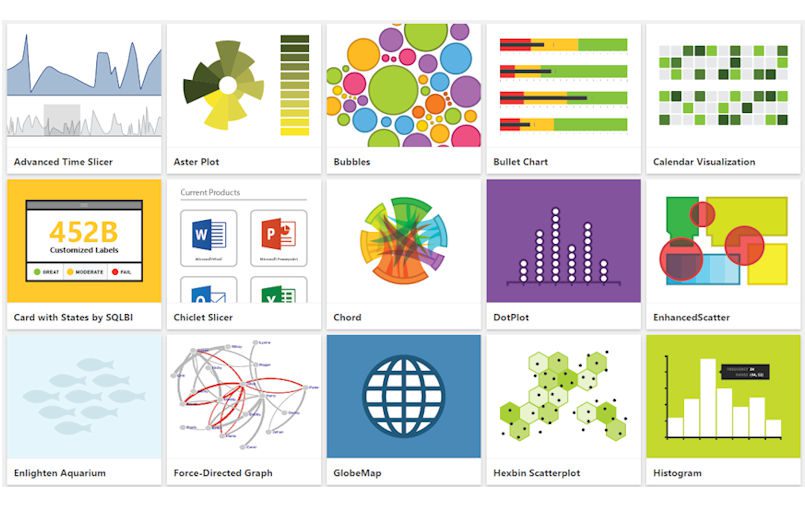
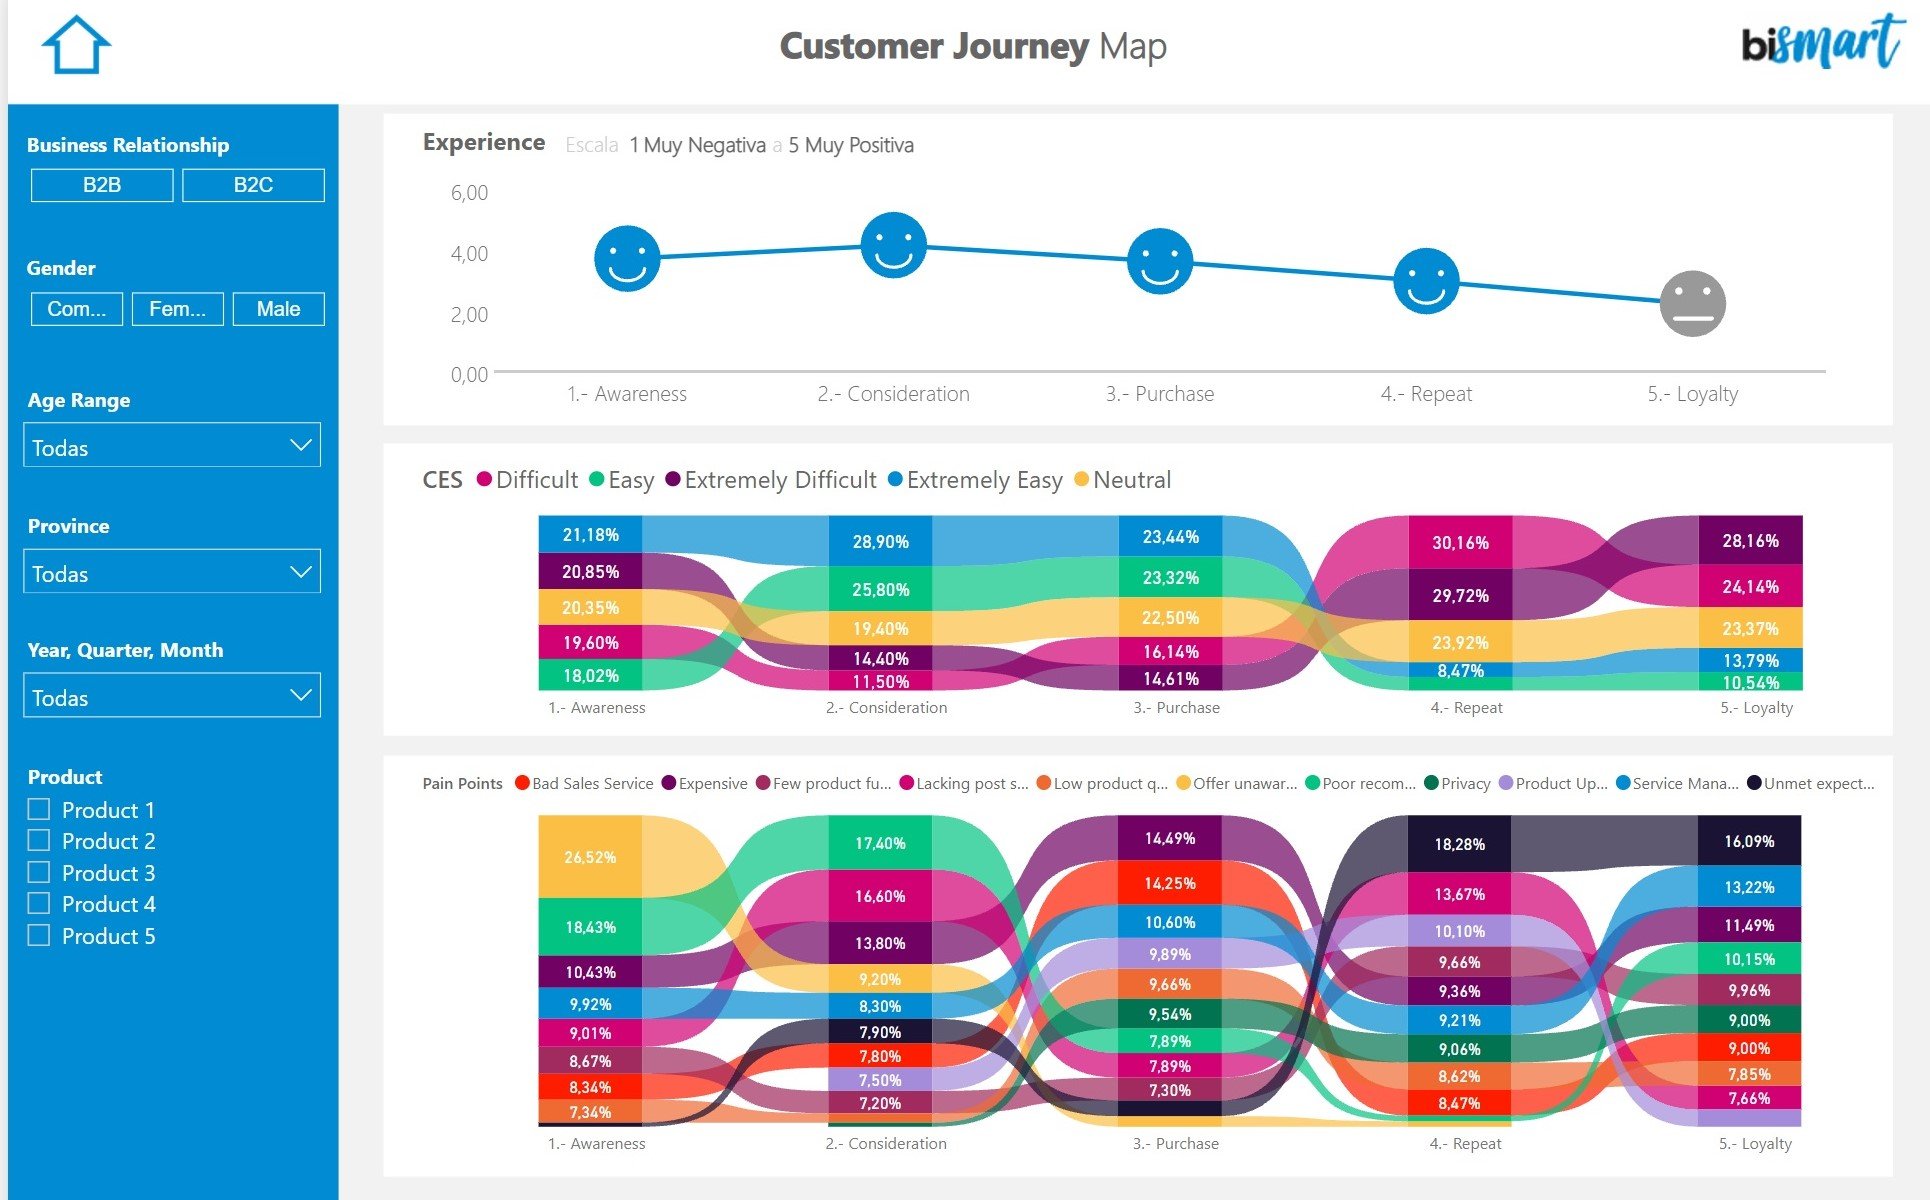
Description: The process of creating a visualization using Power BI on a company database involves several steps, including data integration, data transformation, report creation, and dashboard implementation 1 . The first step is
to extract data from the company database using Power BI connectors, which enable the integration of data from various sources, including Excel files, online servers, and web services or APIs 1 2 . The data is then transformed and
cleaned using Power BI's data transformation capabilities, which provide a comprehensive set of tools for data pre-processing, including cleaning, merging or splitting columns, eliminating duplicates, and creating calculated columns
and measures
Research Intern
Company Name: Steep Graph
Duration: Oct 2023 - Jan 2024
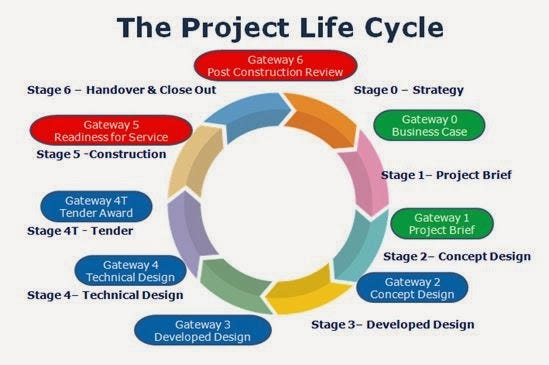
Description: The 3DX Platform is a comprehensive digital platform that integrates various tools and solutions for product design, engineering, simulation, manufacturing, and project management. Developed by Dassault Systèmes, it provides
a collaborative environment where teams can work together, share data, and manage projects efficiently. The platform includes features such as Product Lifecycle Management (PLM), collaboration tools, simulation and modeling, and data
management. By using the 3DX Platform, organizations can streamline their product development processes, improve collaboration and communication among team members, and make data-driven decisions. The platform's centralized data management
capabilities ensure that all stakeholders have access to accurate and up-to-date information, reducing errors and improving overall product quality